
Mehwish Faiz1*, Tamima Imtiaz2, Bushra Zafar3, Fahad Shamim4, Sehrish Khan5, Hamnah Abid6
1*Assistant Professor, Biomedical Engineering Department Ziauddin University, (FESTM), Karachi, Pakistan![]()
2Student, Biomedical Engineering Department Ziauddin University, (FESTM), Karachi, Pakistan![]()
3Assistant Professor, Biomedical Engineering Department Ziauddin University, (FESTM), Karachi, Pakistan![]()
4Assistant Professor, Biomedical Engineering Department IBET, LUMHS Jamshoro, Pakistan![]()
5Student, Biomedical Engineering Department Ziauddin University, (FESTM), Karachi, Pakistan![]()
6Student, Biomedical Engineering Department Ziauddin University, (FESTM), Karachi, Pakistan![]()
ABSTRACT
Background of the Study: The prevailing cause of Diabetes is a decline in insulin production, the outcome of which is an elevated glucose level in the blood. The superabundance of glucose in the blood can cause severe complications, damaging other body organs, including kidneys, nerves, heart, and upper and lower limbs. However, the common complication in diabetic patients is foot ulcer, which is directly associated with Diabetic peripheral neuropathy (DPN), which is the extensive cause of this. DPN is the inability of nerves to sense any external change, due to which the foot plantar pressure is altered and evolves because of the high glucose level.
Methodology: This paper provides a solution in the form of a portable and cost-effective device based on force sensors for diabetic patients to monitor the change in foot plantar pressure at home and overcome the risk of foot ulceration. The device is implemented on 30 participants to characterize the plantar pressure values with flat foot and normal foot types for the Control group and diabetic group.
Results: An evident difference in the value of Mid-foot pressure is observed for both the groups, Control group (Normal foot = 144+2.63 kPa, Flat foot = 150+2.72 kPa) and Diabetic Group (Normal foot = 213+2 kPa, Flat foot = 216+1 kPa). Deviation in these values discriminates the mid-foot pressure for the two groups, thus providing us a range for the individuals of the control group for the alarming situation.
Conclusion: Noticing the plantar pressure through the proposed device helps diabetes patients reduce their risk.
Keywords: Blood glucose, type 1 diabetes mellitus, flat foot, metatarsal, foot orthosis, diabetic neuropathy, foot ulcers.
Introduction
Neuropathy is a commonly found condition in diabetic patients and is characterized by symptoms of defective peripheral nerves. Patients with Diabetes (all types) can develop Diabetic neuropathy. With time, the chances of neuropathy increase 1 in diabetic patients. Many kinds of the syndrome can be caused by diabetes2. Toronto Consensus Panel on Diabetic Neuropathy described. Diabetic Neuropathy by stating that “uniform, distance-dependent sensorimotor polyneuropathy derivable to metabolous and micro-vessel alterations as a product of long-term hyperglycemia risk and cardiovascular possibility covariates”3. Diabetic patients may develop different forms of neuropathy2. Despite non-identical pathophysiology, primarily type 1 and type 2 diabetes, there has been a well-established suspicion that the phenomena which lead to diabetic neuropathy are collective. This suspicion has nowadays been called into examination4. As compared to Type 1 diabetes (54%-59%), Type 2 diabetes (which is more common) has less lifespan occurrence (45%) of neuropathy5. The lower part of the body is the foot, which carries the whole body’s weight. Positioning muscles, joints, and bones permit movement by bearing and absorbing vigorous pressure while walking and standing6. The principal place of excessive weight on the sole are three: the center of the heel and the first and fourth-fifth heads of the metatarsal. The uniform arrangement of the physiological pressure distribution patterns on the sole provides stability to our body7. Peripheral neuropathy is the primary source of dysfunction in patients with diabetes8,9. It is considered that about 50% of diabetic patients may show signs and symptoms of diabetic peripheral neuropathy 10-15 years after diagnosis. For the evaluation of patients with Diabetes, plantar pressure is a crucial factor. Higher plantar pressures are developed due to Diabetes. Diabetic neuropathy is responsible for critical nerve dysfunction. This nerve dysfunction usually leads to the ulceration of the foot. Due to the changes in the gait of the diabetic patient along with changes in soft tissues, the chances of foot ulceration usually increase 10. It is challenging to treat ulceration; these feet ulceration usually leads to infection and eventually to amputation of the lower extremity. Neuropathy influences the internal foot muscles and grows in demented pedal design, preceding clawing of the toes and prominent metatarsal heads on the plantar exterior. The shear forces are increased due to the skin covering the bulging head of the metatarsal, causing injury in the callus and subcutaneous tissues, eventually leading to ulceration11,12. Dysfunction of the nerve results in the elevation of the plantar pressure of individuals with Diabetes. Patients with type 1 may also go through severe diabetic neuropathy in the start when their blood sugar is not in control13,14. The estimations of plantar pressure can detect the connection of foot structure and function of the foot, as this method allows one to estimate the pressure under the plantar foot. Monitoring devices for foot pressure are available, but these devices are either very expensive or not portable. This insole can detect the plantar pressure of diabetic patients at home to examine their plantar pressure distribution since this device is highly portable and easy to use. The working of the foot and ankle is determined by the readings of pressure in the plantar surface of the foot; the foot and ankle give required assistance in load carrying and load transferring purposes6.The foot’s position is divided into three possible types: standard, supinated, and pronated15. Many pieces of research are found on monitoring plantar pressure during the gait cycle, but very few are found on plantar pressure estimation during standing12,16,17,18. This study aims to measure the plantar pressure and determine the difference between the plantar pressure distributions of patients with diabetic neuropathy and control groups. Diabetes is a frequently occurring health problem that leads to sickness and death worldwide. This disease has a high risk of developing high-pressure ulcers, especially in an individual’s lower limb. In 2012, it was estimated among the population of the U.S. that 9.3% of people were affected by Diabetes, among which 25.9% were affected were people above the age of 65 years (11.8 million)13. It is estimated that approximately 50% to 60% of patients will develop Diabetic Peripheral Neuropathy (DPN) within a year after being diagnosed with Diabetes. It is one of the most probable outcomes of Diabetes Mellitus that occurs due to severe nerve deterioration, and most often, it deteriorates the nerves of legs and feet, and this nerve damage can lead to diabetic foot ulceration. The risk of foot ulceration is high in patients with Diabetes due to changes in their gait patterns and biomechanical changes in their legs and feet. In the diabetic neuropathic patient, there was a prolonged interval between heel strike and toe-off, generally more than double to normal controls. It is essential to underline the long contact time in diabetic neuropathic patients15,19,20. Pressure and contact time are vital in distinguishing a diabetic neuropathic foot from a non-neuropathic diabetic foot16.There is a strong association between diabetic neuropathy and higher plantar loads that may be responsible for foot ulceration. For scrutinizing the plantar pressure in diabetic patients, different methods and techniques are used, including the Pedar-X system. The Pedar-X is one of the newer versions of the in-shoe pressure distribution measuring system covering the whole plantar surface of the foot. This Pedar system comprises a sensor-based insole that can be used with multiple synchronization options, including EMG and video systems for gait analysis. It gives the output results in a Pedograph, the colored footprints where different colors show the pressure distribution in the plantar surface. During the procedure, the patients walked at control cadence on a walkway of 10 meters while wearing Pedar-X insoles inside anti-skid socks. The insoles consisted of a matrix of at least 99 capacitive pressure sensors with 1.6-to-2.2-centimeter square spatial resolution and thickness of 2.5 millimeters3. The Pedar-X System gives accurate results, but the patients must perform their gate cycle by walking or running at a moderate speed. The basic technique in 21is the F-scan (Tekscan, Boston, MA, USA), which uses a computerized 3D dynamic tactile plantar pressure distribution analysis system. This insole sensor system can measure critical surface interface pressure with 960 independent sensing regions arranged in a matrix. The output is displayed quantitatively as the pressure distribution profile using 3D graphs with different colors indicating the different pressure levels. One more proposed technique is to use highly reliable measurement devices, Tekscan High-Resolution Floor Mat System (Tekscan Inc., South Boston, MA, USA), to calculate Peak Plantar Pressure (PPP) and Gait-RITE mat (Gait-RITE CIR Systems, Inc., Havertown, PA, USA) to measure a steady-state walking speed and gait variables such as cadence, step length, step time, toe-out angle, and peak plantar pressure22. This study showed that walking speed in the diabetic group is slowed, not by decreasing a step length, but by increasing step time compared with the age–gender-matched group. The results of this study also showed variation in the peak plantar pressure distribution. A different approach in23 avails an F-scan system for polarography. This foot insole system uses a thin layer of pressure sensors and contains more than 960 sensors, trimmed according to the foot size of the patient. Pedobarography was performed without orthosis at the initial visit, and two weeks later, it was done with an orthosis. Patients were given custom-made foot orthosis and asked to walk with them until a stable cadence was achieved. The patient’s gait patterns were also examined and recorded for 8 seconds to distinguish the change in the plantar pressure after using orthosis for two weeks. Ultimately, the patients were also asked to answer Health Assessment Questionnaire (HAQ) and Foot Function Index (FFI). No significant difference was noted in the plantar pressure after two weeks in which foot orthosis were worn for an average of 7 to 8 hrs/day. Insoles may help relieve pain and provide comfort but cannot help improve the condition23. In Foot scan 7.97 gaits 2nd generation was utilized to analyze the pressure data24. Moreover, an approach of semi-automatic mapping was also used to recognize ten regions of peak-pressure footprints for each trail. The areas of observation were hallux (T1), toes 2 to 5 (T2–T5), the individual metatarsal heads (MTH) 1 to 5 (MTH1-5), midfoot (MF), medial heel (HM) and lateral heel (HL). Following semi-automatic total mapping, the peak force sensor and force-time integral were extracted for all regions of observations, excluding the MF and toe 2 to 5. The measurement of dynamic barefoot plantar pressures of individuals was observed at self-selected walking speed. The only limitation of this study might be the sample size of the person with Diabetes and the control groups. Another study uses Foot Pressure SN GP MultiSence 4–2008-703 (Gebiom mbH Munster)17 to assess Plantar pressure distribution. The subjects were asked to stand on the device barefoot in a static fashion. Afterward, the patients were instructed to walk on the device’s surface while dynamic pressures were measured for both feet. The group with severe neuropathy had diabetes for a more extended period than those without neuropathy, according to a summary of the study’s demographic characteristics. The severe neuropathy group showed greater values in the heel, midfoot, and medial forefoot than in diabetic patients without neuropathy. Compared to these diagnostic devices and techniques, the study’s objective is to design a device with a simplified circuit with fewer hardware parts and effective in terms of cost and availability. Moreover, it is also patient-friendly as it does not force patients to perform a gait cycle while doing experiments. The results are achieved by placing the proposed foot insole in the shoes, which will measure the plantar pressure of the foot during routine ambulation activities.
Methodology
Architectural Design and Mechanical Assembly
The proposed device comprises eight Force Sensitive Resistors (FSRs) interfaced with Arduino through MATLAB code to analyze the pressure distribution patterns of the plantar foot. Fig. 1 shows the block diagram of the device.
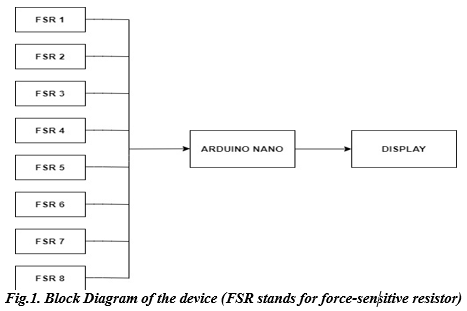
The force-resistive sensor helps detect force by altering its resistance when applying pressure. The principle involved is that when a force is applied to a sensor film’s surface, particles touch the conducting electrodes, changing the film’s resistance. Even though there are many different kinds of force sensors, force-sensitive resistors provide several benefits, including a small size (less than 0.5 mm), meager cost, and strong shock resistance. FSR sensors’ resistance reduces as more pressure is applied to their surface.
They take input analog signals from the patient’s plantar foot to generate readings on the serial monitor of Arduino Nano. Arduino Nano is a compact microcontroller with an operating voltage of 5V. This component’s additional benefit includes its power consumption, which is approximately 19 mA, small size, and eight input analog pins. These analog pins take the input from the force-sensitive resistors on the foot’s placement on the insole. The force applied is processed, analyzed, and displayed as plantar pressure in kilopascals (kPa).
Placements of FSRS in Proposed Device
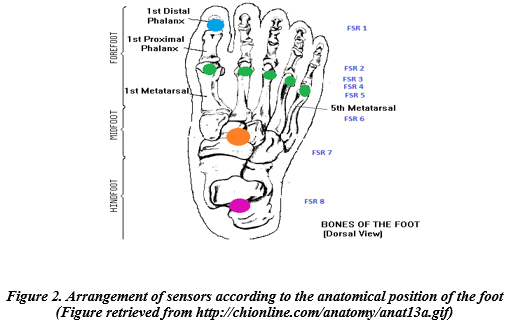
These force sensors in the proposed device are placed on a foot insole for anatomical positions: Hallux, Medial forefoot, Lateral forefoot, Medial mid-foot, Lateral mid-foot, and heel, respectively. Their arrangement is on each metatarsal head 1-5, one sensor on the hallux, one on the mid-foot region, and one on the heel region. Figure2 shows the arrangement of the sensors on the designed insole.
Data Collection
The proposed device was implemented on diabetic patients and healthy participants to discriminate the change in plantar pressure values of two groups by acquiring the pressure values from distinct locations of the foot. A group of 30 people, in which diabetic patients with different foot types (Flat foot and Normal Foot) and a control group (Flat foot and Normal Foot) with no history of any foot surgery or severe injury were taken. According to the Inclusion criteria for the study, Individuals with DPN but no foot ulcer are selected for the Diabetic Group and Control Group; participants with no diabetes are chosen while the age range is from 35-65 years for both groups. However, in the Diabetic Group, participants with foot ulcers are excluded. Subjects are divided into two groups control group and the diabetic group. For the control group, 20 healthy individuals participate in this research, and for the diabetic group, ten people to participate. Stratified sampling is applied as it entails breaking the population up into smaller groups that might have significant differences. Ensuring that each subgroup is fairly represented in the sample enables us to reach more accurate findings. Diabetic patients are asked some questions regarding their history of diabetes. Out of 10 diabetic patients, eight were diagnosed with diabetes 5-6 years ago, and only two were diagnosed with diabetes eight years ago. They were also asked whether they felt pain in their plantar foot region. Patients with foot ulcers or a history of foot ulcers are not asked to participate in this research. The subject’s age ranges from 35-65 years. They are asked to place their foot on the foot insole to display the plantar pressure in kPa on the serial monitor. For this procedure, multiple visits to a clinic were done over a period of 3 months. The following section contains the details of the data collection findings.
Results
To display the plantar pressure in kPa, the participants of the two groups were instructed to place their feet on the foot insole. Table 1 shows the collected data from the Control Group with normal foot and flat foot participants who do not have problems with diabetic neuropathy and ulceration. Referring to Table 1. It is noticeable that the Midfoot pressure values are distinct for Normal foot and flat foot.
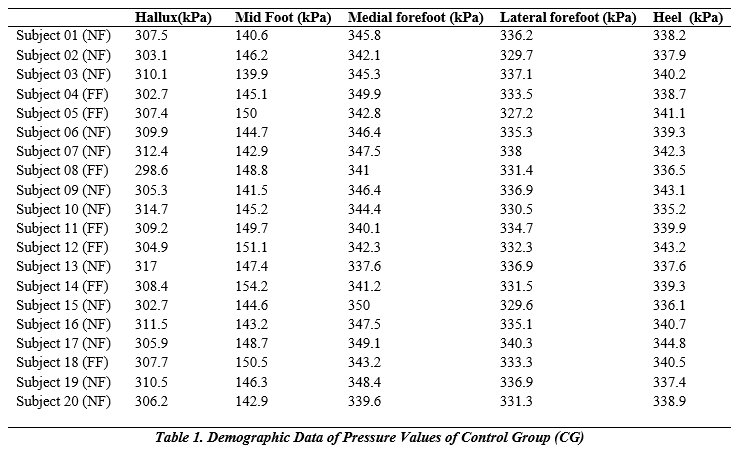

Figures 2(a) and 2(b) show the Plantar pressure values of the Control Group for both normal and flat-foot individuals. For this analysis, 13 subjects have normal feet, while 07 subjects have flat feet with no diabetes. It is noticeable from the bar graph that there is no considerable difference between the values of pressure of hallux, midfoot, medial forefoot, lateral forefoot, and heel of the Control group individuals; however, the foot type is different. However, mid-foot pressure is an essential parameter of plantar pressure distribution as it is a vital indicator of an individual’s condition. This value ranges from 139.9 kPa to 148.7 kPa for individuals with normal feet, while it ranges from 145.1 kPa to 154.2 kPa for flat feet. Table 2 shows the collected data from the diabetic neuropathy group (DN). From Table 2 of Diabetic neuropathy patients, the midfoot pressure for flat foot patients is higher than normal foot type persons.
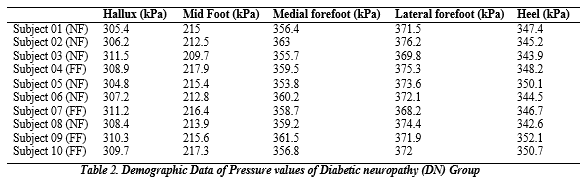
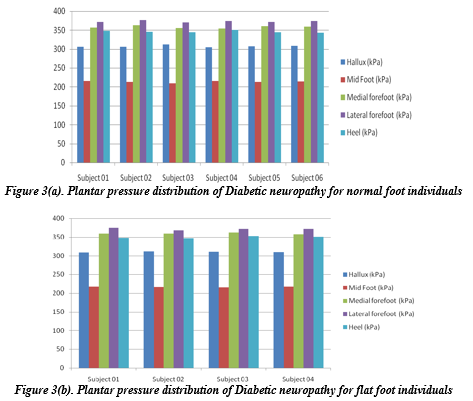
Figures 3(a) and 3(b) show that the midfoot pressure varies from 209.7 kPa to 215.4 kPa for normal foot type persons and 215.6 kPa to 217.9 kPa for flat foot patients. For this investigation, 06 individuals with normal feet and four with flat feet are selected with Diabetic Neuropathy. On comparing the results of Figure 2(a), 2(b) and Figure 3(a), (b), it is evident that the mid-foot pressure for flat foot diabetic person is very high as compared to flat-foot normal individuals (Control group) and the pressure value is far-ranging. By monitoring this compelling parameter along with others, plantar pressure changes can be observed. This alteration is one of the extensive causes associated with foot ulcers; thus, regularly tracking this parameter helps diabetic patients overcome foot ulcers’ pathogenesis.
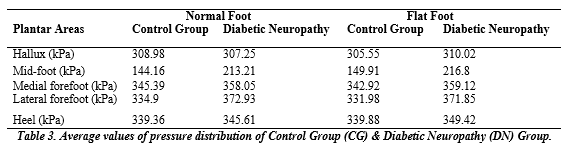
Table 3 illustrates the average mean pressure distribution results for the Control Group and Diabetic Neuropathy Group for Normal foot and flat foot individuals. The pressure values reveal a significant alteration in the value of Midfoot pressure of the Control Group and Diabetic neuropathy group for both normal foot and flat foot. Moreover, it is also clear from the outcomes that a value greater than 320 kPa for Hallux Pressure, mid-foot pressure more than 225kPa, Medial forefoot value greater than 370 kPa, a value greater than 385 kPa for Lateral forefoot, and a value greater than 355 kPa for heel pressure may lead to foot ulcer.
Comparison of results of our proposed insole with Pedar x-System:
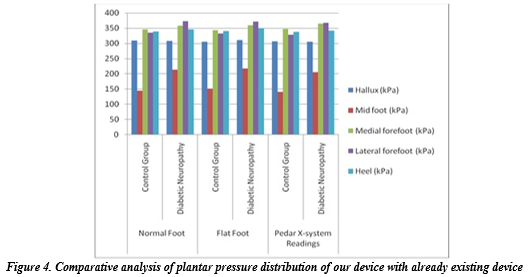
Figure 4 shows the comparative graphical display of the results obtained from our smart insole and Pedar X-system [3] for the control group (no diabetes) and Diabetic Neuropathy Group. This comparison correlates our device’s outcome with standard values mentioned in [3] to validate our device. The bar diagram shows that the importance of pressure measured from distinct points of the foot is approximately the same. Deviation in the value of mid-foot pressure is noticeable. Moreover, our device measured the pressure values for different foot types, a promising feature lacking in Pedar X-system.
Discussion
According to the International Diabetes Federation, 9.1-26.1 million diabetic patients will experience diabetic foot ulcers (DFUs) annually. Moreover, following diagnosis, one in four diabetic patients will develop at least one-foot ulcer, and they are a diabetic complication that may lead to amputation if not treated25. One of the major factors responsible for this complication is Diabetic peripheral neuropathy (DPN), which in turn is associated with a change in plantar pressure of the foot. Thus, monitoring the foot pressure values of a diabetic person may help apprehend this frightening situation before the onset of a foot ulcer. This foot insole aims to design an easily accessible and low-budget solution for monitoring the plantar pressure of diabetic patients to keep an eye on the complexity of their condition even at home.
Conclusion
At this stage, we can conclude that Diabetic Neuropathy affects the performance of foot muscles, significantly altering plantar pressure in these individuals. Moreover, foot type influences plantar pressure distribution and can impact an individual’s motion dynamics. This is evident from the readings, which show more mid-foot pressure distribution for flat-foot people. Higher mid-foot pressure is associated with the deviation of weight bearing pattern from the lateral part of the foot to the medial side. Our proposed device for detecting pressure distribution patterns on different foot types in diabetic patients is simple, patient-friendly, economical, and can be used at home. Monitoring plantar pressure aids diabetic patients in overcoming the chances of foot ulcers in the long term and maintaining a robust lifestyle in the short term26. This device is critical for individuals with diabetes for a long time or with very high glucose levels, as they are at higher risk of foot ulcers. Foot ulceration is critical because it may lead to infection and, in severe cases, may cause amputation.
AUTHORS’ CONTRIBUTION:
The following authors have made substantial contributions to the manuscript as under:
Conception or Design: Mehwish Faiz, Sehrish Khan, Hamnah Abid
Acquisition, Analysis or Interpretation of Data: Mehwish Faiz, Tamima Imtiaz, Sehrish Khan, Hamnah Abid
Manuscript Writing & Approval: Bushra Zafar, Fahad Shami, Hamnah Abid
All authors acknowledge their accountability for all facets of the research, ensuring that any concerns regarding the accuracy or integrity of the work are duly investigated and resolved.
ACKNOWLEDGEMENTS: We thanks all the participants in this study.
INFORMED CONSENT: Written Informed Consent was taken.
CONFLICT OF INTEREST: The authors declare there is no conflict of interest
FUNDING STATEMENTS: This work receives no external or internal funding.
ETHICS STATEMENTS: The protocol of the present study was registered by the local ethics committee of ZUFESTM with approval code ERC/ZUFESTM/009
References
- Svoboda Z, Janura M, Kralova L, Vareka I. The influence of foot type on pressure distribution during gait. Gait & Posture. 2014;39:S67
- Taha Z, Norman M, Omar S, Suwarganda E. A Finite Element Analysis of a Human Foot Model to Simulate Neutral Standing on Ground. Procedia Engineering. 2016;147:240-245.
- Bacarin T, Sacco I, Hennig E. Plantar Pressure Distribution Patterns During Gait in Diabetic Neuropathy Patients with a History of Foot Ulcers. Clinics. 2009;64(2):113-120.
- Jarrett L. Prevention and management of neuropathic diabetic foot ulcers. Nursing Standard. 2013;28(7):55-65.
- Boulton A, Kirsner R, Vileikyte L. Neuropathic Diabetic Foot Ulcers. New England Journal of Medicine. 2004;351(1):48-55.
- Bondar A, Popa A, Papanas N, Popoviciu M, Vesa C, Sabau M et al. Diabetic neuropathy: A narrative review of risk factors, classification, screening and current pathogenic treatment options (Review). Experimental and Therapeutic Medicine. 2021;22(1):1-9.
- Buldt A, Murley G, Butterworth P, Levinger P, Menz H, Landorf K. The relationship between foot type and lower limb kinematics during walking: a systematic review. Journal of Foot and Ankle Research. 2012;5(S1).
- Gawronska K, Lorkowski J. Evaluating the Symmetry in Plantar Pressure Distribution under the Toes during Standing in a Postural Pedobarographic Examination. Symmetry. 2021;13(8):1476.
- Ko M, Hughes L, Lewis H. Walking speed and peak plantar pressure distribution during barefoot walking in persons with diabetes. Physiotherapy Research International. 2011;17(1):29-35.
- Gravante G, Russo G, Pomara F, Ridola C. Comparison of ground reaction forces between obese and control young adults during quiet standing on a baropodometric platform. Clinical Biomechanics. 2003;18(8):780-782.
- Baris R, Narin S, Elvan A, Erduran M. FRI0638-HPR Investigating Plantar Pressure during Walking in Plantar Fasciitis. Annals of the Rheumatic Diseases. 2016;75(Suppl 2):1284.3-1285.
- Periyasamy R, Anand S. The effect of foot arch on plantar pressure distribution during standing. Journal of Medical Engineering & Technology. 2013;37(5):342-347.
- Economic costs of diabetes in the U.S. in 2012. Diabetes Care. 2013;36(4):1033–46.
- Duan Y, Ren W, Liu W, Li J, Pu F, Jan Y. Relationship Between Plantar Tissue Hardness and Plantar Pressure Distributions in People With Diabetic Peripheral Neuropathy. Frontiers in Bioengineering and Biotechnology. 2022;10.
- Ahmad N, Thomas GN, Gill P, Torella F. The prevalence of major lower limb amputation in the diabetic and non-diabetic population of England 2003–2013. Diabetes and Vascular Disease Research. 2016;13(5):348–53.
- Van Schie C, Boulton A. Biomechanics of the Diabetic Foot. The Diabetic Foot. 2006;185-200.
- Abri H, Aalaa M, Sanjari M, Amini M, Mohajeri-Tehrani M, Larijani B. Plantar pressure distribution in diverse stages of diabetic neuropathy. Journal of Diabetes & Metabolic Disorders. 2019;18(1):33-39.
- Hsiao H, Guan J, Weatherly M. Accuracy and precision of two in-shoe pressure measurement systems. Ergonomics. 2002;45(8):537-555
- Bagherzadeh Cham M, Mohseni-Bandpei M, Bahramizadeh M, Kalbasi S, Biglarian A. The effects of vibro-medical insole on sensation and plantar pressure distribution in diabetic patients with mild-to-moderate peripheral neuropathy. Clinical Biomechanics. 2018;59:34-39.
- Yu X, Yu G, Chen Y, Liu X. The Characteristics and Clinical Significance of Plantar Pressure Distribution in Patients with Diabetic Toe Deformity: A Dynamic Plantar Pressure Analysis. Journal of International Medical Research. 2011;39(6):2352-2359.
- Ko M, Hughes L, Lewis H. Walking speed and peak plantar pressure distribution during barefoot walking in persons with diabetes. Physiotherapy Research International. 2011;17(1):29-35.
- Paiva Magalhães E. Foot Pain, Function and Plantar Pressure Distribution in Rheumatoid Patients Wearing Insoles an Observational Study. Biomedical Journal of Scientific & Technical Research. 2018;2(2).
- Deschamps K, Matricali G, Roosen P, Desloovere K, Bruyninckx H, Spaepen P et al. Classification of Forefoot Plantar Pressure Distribution in Persons with Diabetes: A Novel Perspective for the Mechanical Management of Diabetic Foot?.PLoS ONE. 2013;8(11):e79924.
- Armstrong DG, Boulton AJM, Bus SA. Diabetic foot ulcers and their recurrence. New England Journal of Medicine. 2017;376(24):2367–75.
- ZHI X, WANG W, XU B, ZHOU J. Effectiveness of Pressure-Relieving Shoes/Insoles on Lowering the Plantar Pressure of Diabetic Foot: A Meta-Analysis. Leather and Footwear Journal. 2020;20(4):361-374.
- Chow T, Chen Y, Hsu C. Relationships between Plantar Pressure Distribution and Rearfoot Alignment in the Taiwanese College Athletes with Plantar Fasciopathy during Static Standing and Walking. International Journal of Environmental Research and Public Health. 2021;18(24):12942.
The Ziauddin University is on the list of I4OA, I4OC, and JISC.
This is an open- access article distributed under the terms of the Creative Commons Attribution License (CC BY 4.0).