
ABSTRACT
OBJECTIVE
To study the effects of BMI on temporal-spatial gait parameters in young adults
TARGET POPULATION AND SAMPLE SIZE
Target population in this study is students. Total 40 students participated in this study. Participants were drawn from College of Physical Therapy.
STUDY DESIGN
Observational study
METHOD
40 young adults both male and female were selected, keeping 10 students in each group of underweight, normal weight, overweight and obese. Each participant was instructed to walk over 20 meters area both indoor and outdoor at their normal pace wearing normal footwear. Step length and cadence were measured and gait velocity of each participant was calculated. Results were compared for both outdoor and indoor walk.
RESULT
The result of this study revealed statistically no significant differences in the measured variables between four groups, i.e. underweight, normal weight, overweight, and obese young individuals in both outdoor and indoor settings and found significant difference is indoor walk step length and gait velocity. Overweight and obese individuals have shorter step length and gait velocity, underweight individuals walk was better than other groups
CONCLUSION
The study shows no difference in gait in relation of BMI. There was the difference in step length and gait velocity in overweight and obese individual.
KEYWORDS
BMI, Temporal-Spatial Gait Parameters, Underweight, Normal Weight, Overweight, Obese
Nabeel Baig
Senior Lecturer
Ziauddin College of Physical Therapy
Ziauddin University
Sundus Masood
DPT Student
Ziauddin College of Physical Therapy
Ziauddin University
Shazia Qudrat
DPT Student
Ziauddin College of Physical Therapy
Ziauddin University
Asif Ashiq Ali
DPT Student
Ziauddin College of Physical Therapy
Ziauddin University
[Baig N, Masood S, Qudrat S, Alif AA. Association of BMI on Temporal-Spatial Parameters of Gait in Young Adults. Pak. j. rehabil. 2016;5(2):49-56]
INTRODUCTION
Walking is the most widely recognized human physical exercise that we all perform regularly 1,2. When a person begins to walk initially from their first year of life, they learn to walk quickly until they adapt an individual walking manner3. Walking, running and standing creates a challenge for us to maintain our balance at all the time. In spite of the individual own way of walking, people adapt certain abnormal gait patterns that can cause future problems while walking like heel, knee and back pain. According to the researches, about 50% of the falls occur when we walk4. Our body is challenged more when we initiate walking, turning, saving ourselves from bumping into obstacles and terminating the walking 5,6. Gait is a series of rhythmical, alternating movement of trunk and lower body that causes the center of gravity and body to move forward. The characteristic features of walk comprise of an alternating rhythmical swinging forward of the leg and foot strike that incorporates all the joint and muscle of the human body7. Gait analysis is a tool to asses, plan and treat their problem for those individuals who have abnormal gait pattern, gait. For gait analysis, we study different temporal (time) and spatial (distance) parameters; more importantly are gait velocity and cadence3. Spatiotemporal gait parameters are the mostly used objectives performed in the clinical setting, commonly gait velocity and cadence is the most broadly used measure and is supposed to be a good presentation of overall gait performance. Gait velocity may additionally be utilized as a pointer of fall risk, fear of falling and to determine the decrease in motion. Cadence is a number of steps taken in a minute; step length is the distance from heel-to-heel or toe to toe of the same foot whereas gait velocity is the proportion of step length and cadence 8, 9. For a healthy body weight, it is important to know Body Mass Index (BMI). To measure the particular attributes of gait parameters it is important to compare these parameters with BMI i.e. underweight, normal weight, overweight and obese in young adults3. Healthy weight is a part of overall great wellbeing. To enjoy the attributes of health, having energy for work and having the ability to think clearly it is important that one should have a good healthy weight. A man who tires rapidly and needs essentialness may have weight that is putting the individual far from accomplishing his/her objectives. Healthy weight is statistically related to good health. Being above or below the range may cause health issues as well as mobility problems7. Excess body weight is related to major clinical and general wellbeing issues10 and muscular activity11. It has been studied that locomotion may be more directly related to weight12. According to the WHO classification for BMI, weight <18.5 kg/m2 is underweight, weight in between 18.5-24.9 kg/m2 is normal weight, 25-29.9 kg/m2 is overweight and >30 kg/m2 is obese13. In 2005, the total numbers of overweight and obesity were 937 million and 396 million respectively. The occurrence of obesity has increased in recent years10. Related potential wellbeing dangers have been recognized in the adult population12. Many pathologies and degenerations of the balance control system in elderly have led the researchers and clinicians to learn and explore more about how the body system works and to identify problems when they arise. As the age of an individual increases, it is getting critical to maintain our mobility due to increase in the falls, injuries and many pathologies in the elderly and is a very major concern of our elderly 4-6. Overweight and obesity are associated with significant mobility issues that can decrease person satisfaction7. Individuals with underweight have 12% body fat ratio in young female and 5% body fat ratio in males13. In adults, gait parameters can vary with increasing adiposity, and can cause slow walking speed and greater base of support 14,15. Up till now the limited number of studies has been published focusing on gait characteristics in obese16. According to the Lancet Medical Journal, 33% of adult in Pakistan are overweight or fat with more women gaining weight than men 17,18. The study conducted by the corporation of scientists around the globe of the Institute for Health Metrics and Evaluation (IHME) at the University of Washington shows that 30 percent rate of adults overweight and obesity have increased to 37 percent in 2013 since 198017. Pakistani youngsters are overweight and their weight rate was six percent for young men and 10 percent for young women in 201318. According to recent study of Global Burden of Disease published in The Lancet medical journal showed that the ranking of Pakistan in terms of obesity was 9th out of 188 countries 19. The purpose of the study is to focus on the impact of body mass index (BMI) on temporal-spatial parameters of gait in young adults in both indoor and outdoor setting.
METHODS
Study Design
Observational study design. It gives an opportunity to see the gait pattern during walking of normal weight, underweight, overweight and obese individuals.
Study population and sample
Target population in this study is students. Participants belonged to Doctor of Physical Therapy (DPT) course and were students of five Batches.
Sample size and selection of sample
Total 40 students participated in this study and their selection was based on each category of BMI.
Sampling Technique
The study was based on random sampling technique through which participants were randomly selected and then grouped into different categories of BMI
Inclusion Criteria
- Female and male, between age of 18-25 years
- Ability to walk 20 meters without use of any assistive device
Exclusion Criteria
- Pregnancy
- Neurologic or orthopedic condition
- Visual and auditory impairment
- Any history of fracture on spine and lower limbs
Study Period
This study was conducted for 2 months. All the data was collected in day time within university scheduled timing hours.
Data Collection Tool
- Assessment form
- Weighing machine and height scale to calculate BMI of each participant
- Digital pedometer to count steps
- Measuring tape for step length
- Stopwatch
- Markers on ground
Procedure
40 young adults both male and female that were meeting the inclusion criteria were selected from College of Physical Therapy. Each participant signed an institutionally approved consent form prior to the study. Members were clarified all the method before the start of the review. Each participant weight was taken in kilograms by weighing scale machine and height was measured in feet from the height scale. Now to calculate the BMI we divided weight by height. Participants were then categorized as underweight, normal, over weight and obese according to the standard WHO BMI classification. We divided 40 students in each category of BMI keeping 10 students in each category. An even surface area was selected and was measured 20 meters walk area on ground. Starting and ending points were marked on ground. Each participant was instructed to walk over 20 meters area on a selected even surface both indoor and outdoor at his or her normal pace wearing normal footwear. Both outdoor and indoor walk area have been selected according to the nearest possible place from university. Step length was measured for each participant by using a measuring tape at the beginning of the walk. To calculate cadence of each individual pedometer was attached on their waistband belt or either placed in pocket to calculate the steps they will walk in one minute. Then researcher started the stopwatch and the participants were instructed to walk 20 meters without taking any rest in between. Each participant was noted down when the participant reached the ending line, time and cadence. Gait velocity (m/sec) was calculated by multiplying step length with cadence of each participant at the end of walk.
Data Analysis Strategies
We used SPSS statistical analysis program to analyze our result. Frequency distribution is determined; Turkey HSD test and one-way ANOVA are applied for this study. We determine the mean and standard deviation of our data by using one-way ANOVA as the nature of our table was quantitative. Also using one-way ANOVA lower and upper limit of confidence interval and significance value was determined using one-way ANOVA. In our study, Turkey HSD is applied. Graphical representation was done with bar charts for better representation and understanding of the result. Normality distribution in the scores was found. Frequency of gender and age are identified. All this was done using SPSS analysis software.
RESULTS
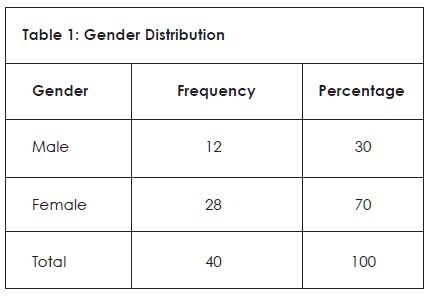
In our study, we aim to determine whether BMI has any effect on temporal spatial gait parameters. For this purpose, we selected 40 participants, 10 in each category of BMI i.e., underweight, normal weight, overweight and obese 12 male with a valid percent of 30% and 28 female with a valid percent of 70% as shown in table 1.
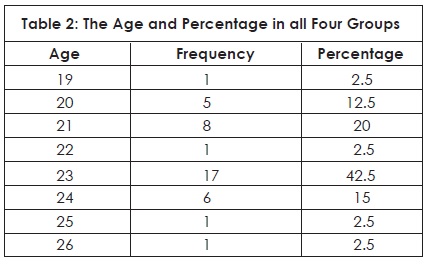
The frequency and percentage according to the age of the participants in the study are shown below in table 2.
Gait Parameters
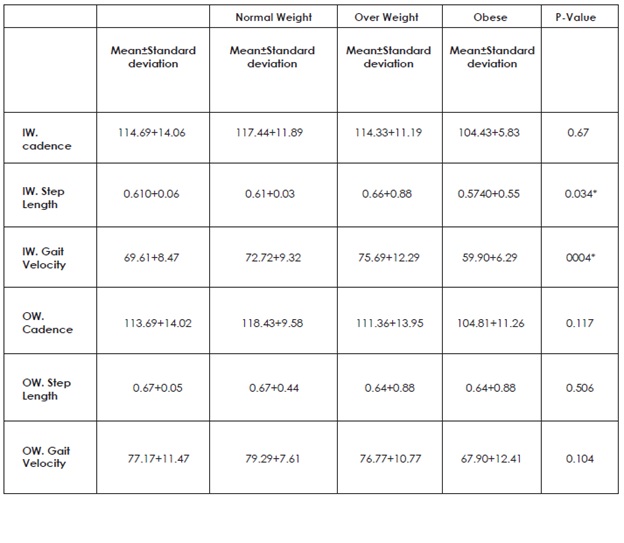
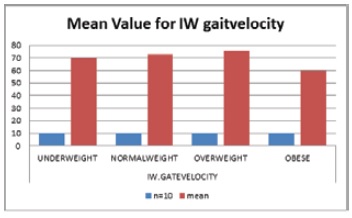
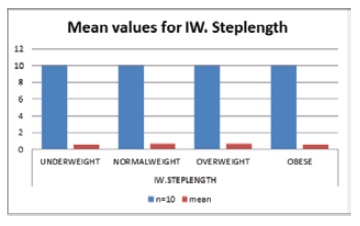
We took each participant step length, cadence and gait velocity in both outdoor and indoor walk in which they walked at 20m area. We started our analysis by using SPSS (one-way ANOVA) which gave us mean and standard deviation of each gait parameter in each category of BMI i.e., underweight, normal weight, overweight and obese as shown in table 3 in both indoor and outdoor. It was found that there is significant difference between indoor walk step length with mean of 0.610 and p-value (0.034) and gait velocity with mean of 69.61 and p-value (0.004) as compared to the outdoor walk step length, cadence and gait velocity in all four groups. P<0.05 was considered significant using one way ANOVA
Table 3: Means and Standard Deviations of Gait Parameters in Indoor and Outdoor Walking
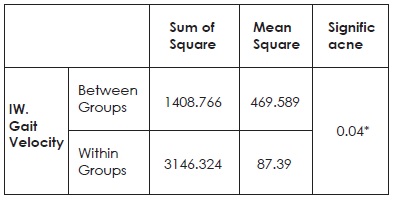
ANOVA test was used for between groups and within groups for sum of square, mean square and significance for indoor walk gait velocity, the result gave statistical difference with p-value (0.04) as shown in table 4.
Table 4: ANOVA Test of Gaint Parameter
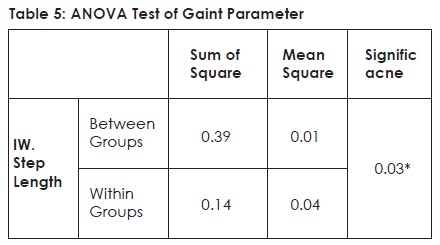
ANOVA test was used for between groups and within groups for sum of square, mean square and significance of indoor walk step length, the result gave statistical difference with p-value (0.034) as shown in table 5
Multiple Comparison using Turkey HSD test
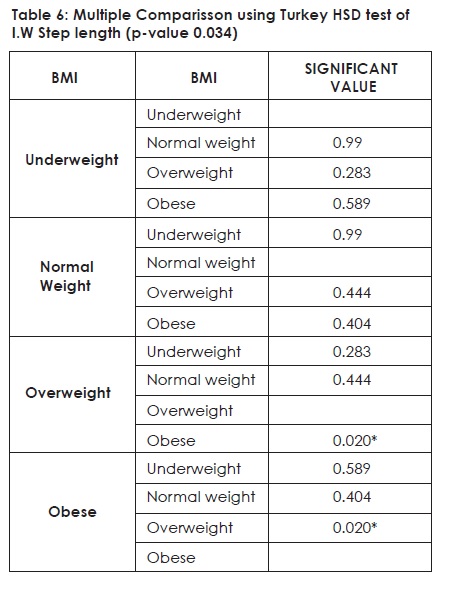
Multiple comparison was done using Turkey HSD test in which comparison was done among four BMI groups in indoor walk step length, in which no significant difference was found between underweight versus normal weight, overweight and obese. Also, no difference was found among normal weight versus underweight, overweight and obese. There was significant difference found between overweight versus obese with a p-value (0.020) while no differences were found between overweight versus normal weight and underweight. Also, there was significant difference found between obese versus overweight with a p-value (0.020) while no significant differences were found between obese versus normal weight and underweight as shown in table 6.
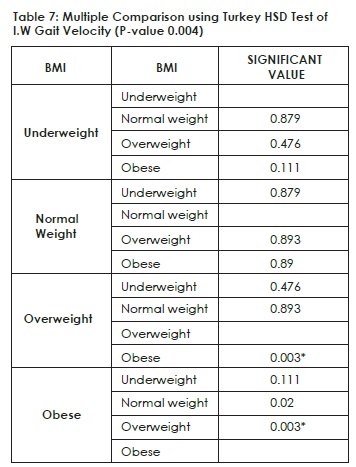
Multiple comparison was done using Turkey HSD test in which comparison was done among four BMI groups in indoor walk gait velocity, in which no significant difference was found between underweight versus normal weight, overweight and obese. Also, no significant difference was found among normal weight versus underweight, and overweight and obese. There was significant difference found between overweight versus obese with a p-value (0.003) while no differences were found between overweight versus normal weight and underweight. Also, there was significant difference found between obese versus overweight with a p-value (0.003) while no significant differences were found between obese versus normal weight and underweight as shown in table 7.
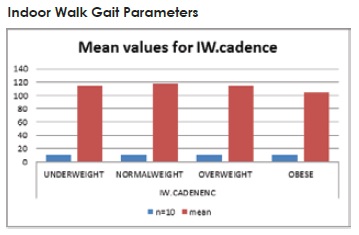
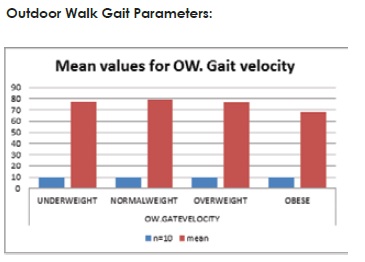
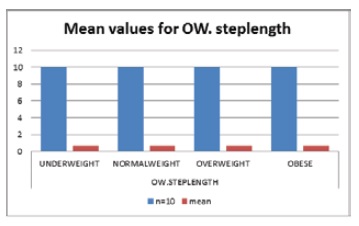
Indoor and Outdoor Walk
Following graphs are represented to show mean values of indoor walk step length, cadence and gait velocity as well as mean values of outdoor walk step length, cadence and gait velocity.
DISCUSSION
The goal of the study was to find whether BMI has any effect on temporal spatial gait parameters in healthy young adults. Such information will help us to predict future fall for adults and provide us movement related abnormalities faced by underweight, overweight and obese individuals and the consequences faced due to unhealthy weight. Overweight and obesity are associated with significant mobility issues that can decrease person satisfaction7.
Energy imbalance results from weight abnormalities. It is observed that underweight children have depleted their body’s fat stores and possibly some of their lean tissues as well because they consume too little food to support their energy activities so to gain weight, they should eat more to expand their energy. While obese and overweight children have expanded energy because they have consumed more food energy so to reduce the body fat they need to exercise and work more to expand their energy they take in from food. Total body weight and increased body fatness in obese and overweight children have a negative influence on children’s physical performance 20,21. Due to the fact that during walking and running, the body fats add to the mass of the body without making a contribution to force generating capacity. Children those are underweight conform their body to the energy storage by decreasing body mass and energy expenditure related to activity. Physical activity and motor performance are reduced because body energy stores are diminished, basal metabolic rate (BMR) and resting metabolic rate (RMR) are diminished22.
The gait parameters used in this study are cadence (steps/min), step length in meter and gait velocity (m/s). Total 40 students participated in this study 12 male and 28 female that met the inclusion criteria of our study. All participants walked in indoor and outdoor area. There were no significant differences noted between underweight step length, cadence and gait velocity in both outdoor and indoor walk when compared with normal individuals. It was also found that there is no significant difference in overweight and obese individual’s step length, cadence and gait velocity when walked in outdoor surfaces. While it was found that there is a significant difference between indoor walk step length (p-value 0.034) and gait velocity (p-value 0.004) in obese and overweight adults when compared with outdoor walk data. There was significant difference found in overweight versus obese group and obese versus overweight group with p-value (0.020) in indoor walk step length. Also, there was significant difference found in overweight versus obese group and obese versus overweight group with p-value (0.003) in indoor walk gait velocity. That means obese and overweight individuals walked with slow speed and distance when compared to normal young adult’s indoor walk data. This may be due to the fact that overweight and obese individuals have more mass and adipose tissue in their legs so they walked with shorter step length and slow speed which alters their gait.
In a research it is suggested that overweight and obese individuals have greater net metabolic cost of walking normalized by body mass. He also suggested that obese and overweight individuals have greater center of mass (COM) displacement which can affect their gait22. Percent body fat is directly related to the net metabolic rate; also, greater net metabolic rate could be a cause of biomechanical changes in gait pattern23.
According to a study gait parameter of children with different weight abnormalities, gait parameters were evaluated using Biodex gait trainer treadmill and compared their results with normal individuals. The study revealed statistically significant difference in obese children with slower gait speed and shorter step length whereas underweight young adult’s results were better than other groups but however less than normal children24.
According to another study with persistent overload of the locomotor system in obese women here were adaptive changes noted to the spatiotemporal gait characteristics. They noticed new biomechanical constrains modifications to the spatiotemporal stride characteristics without noticeable impact on the preferred walking speed and on the stride length due to increased body weight. The stride length remained unaltered which resulted in a significant increase of both limb swing velocity and the stance-to-swing ratio while shortening of the swing time was noted25.
CONCLUSION
The results of this study revealed statistically no significant differences in the measured variables between four groups i.e., underweight, normal weight, overweight, and obese young individuals in both outdoor and indoor settings. In conclusion, overweight, and obese young adults walked with shorter step length and with slow gait speed due to their shorter steps in indoor setting as compared with their outdoor walking and when compared to normal weight young adult’s data. While there were no significant differences found between underweight step length, cadence and gait velocity in both outdoor and indoor walk when compared with normal individual data but their results were better than obese and overweight groups. Despite all of the limitations experienced above, we were able to conduct and complete this study efficiently. Overall results led us to the following conclusion:
- There is significant difference is indoor walk step length and gait velocity.
- Overweight and obese individuals have shorter step length and gait velocity in indoor walk as compared to their outdoor walk.
- Underweight individuals walk was better than other groups however still less than normal group in both outdoor and indoor walk.
REFERENCES
- Aminian K, Najafi B, Büla C, Leyvraz PF, Robert P. Spatio-temporal parameters of gait measured by an ambulatory system using miniature gyroscopes. J Biomech. 2002;35(5):689-699
- Aminian K, Robert P, Jequier E, Schutz Y. Incline, speed, and distance assessment during unconstrained walking. Med Sci Sports Exerc. 1995;27(2):226-234
- Hernández MA, Reyes GR, Urióstegui IQ, Carrera LN, SanPablo AP. Temporal and spatial gait parameters analysis in non-pathological Mexican children. Gait Posture. 2010;32(1):78-81
- Winter DA. Human balance and posture control during standing and walking. Gait Posture. 1995; 3(4):193-214
- Nelson AJ, Certo LJ, Lembo LS, Lo´pez DA. The functional ambulation performance of elderly fallers and non-fallers walking at her preferred velocity. Neurorehabilitation. 1999;13:141–146
- Gabel A, Simons MA, Nayak USL. Falls in the healthy elderly: predisposing causes. Ergonomics. 1985;28(7):965-975
- Khairy S, Ibrahim S, Ahmad G, Abdel Salam h. Gait parameters in children with different weight abnormalities. 2013;5(1):73-84 http://ww w . s c i e n c e p u b . n e t / r e s e a r c h e r / research0501/ 014_14287research0501_73_84.pdf
- Patterson KK, Nadkarni NK, Black SE, McElroy WE. Gait symmetry and velocity differ in their relationship to age. Gait Posture. 2012;35(4):590-594
- Schmid A, Duncan PW, Studenski S, et al. Improvements in speed-based gait classifications are meaningful. Stroke. 2007;38:2096–2100
- Silva-Hamu TCD, Formiga CKMR, Gervásio FM, Ribeiro DM, Christofoletti G, Barros JDF. The impact of obesity in the kinematic parameters of gait in young women. Int J Gen Med. 2013;6:507-513
- Greve J, Alonso A, Bordini AC, Camanho GL. Correlation between body mass index and postural balance. Clinics (Sao Paulo). 2007;62(6):717–720
- Dufek JS, Currie RL, Gouws PL, Candela L, Gutierrez AP, Mercer JA et al. Effects of overweight and obesity on walking characteristics in adolescents. Hum Mov Sci. 2012;31(4):897-906
- Ancel K, Flaminio F, Martti JK, Noboru K, Taylor, Henry L. Indices of relative weight and obesity. Journal of Chronic Diseases. 1972;25(6–7):329–43
- Dufek JS, Mercer JA, Currie R, Gouws PL, Candela L, Gutierrez A et al. Effects of obesity on symmetry and spatio-temporal characteristics of adolescent gait. Las Vegas. http://www. asbweb.org/conferences/2011/pdf/114.pdf
- Wearing SC, Hennig EM, Byrne NM, Steele JR, Hills AP. The biomechanics of restricted movement in adult obesity. Obes Rev. 2006;7(1):13-24
- Blaszczyk JW, Plewa M, SwiderCJ, Bacik B, Markiewicz ZB, Markiewicz A. Impact of excess body weight on walking at the preferred speed. Acta Neurobiol Exp (Wars). 2011;71(4):528-40
- Hossain P, Kawar B, El Nahas M: Obesity and diabetes in the developing world–a growing Challenge. N Engl J Med. 2007;356(3):213-215
- Haslam DW, James WPT. Obesity. The Lancet. 2005;366(9492):1197-1209
- Pakistan 9th most obese country: Study. The Express Tribune 2014 May 29. Available from: https://tribune.com.pk/story/714845/pakistan- 9th-most-obese-country-study/
- Bilney B, Morris M, Webster K. Concurrent related validity of the GaitRite walkway system for quantification of the spatial and temporal parameters of gait. Gait & Posture. 2003;17(1):68-74
- Menz HB, Latt MD, Tiedemann A, Mun San Kwan M, Lord SR. Reliability of the GAITRite walkway system for the quantification of temporo-spatial parameters of gait in young and older people. Gait & Posture. 2004;20(1):20–25
- Cordain L, Gotshall RW, Eaton SB, Eaton SB 3rd. Physical activity, Energy expenditure and Fitness: An evolutionary perspective. Int J Sports Med. 1998;19(5):328-335
- LaRoche DP, Marques NR, ShumilaHN, Logan CR, St Laurent RS, Gocalves M. Excess body weight and gait influence energy cost of walking in older adults. Med Sci Sports Exerc. 2015;47(5):1017–1025
- deSouza SAF, Faintuch J, Valezi AC, Sant’ Anna AF, Gama-Rodrigues JJ, de Batista Fonseca IC et al. Gait cinematic analysis in morbidly obese patients. Obes Surg. 2005;15(9):1238–1124
- Varraine E, Bonnard M, Pailhous J. Intentional on-line adaptation of stride length in human walking. Exp Brain Res. 2000;130(2):248-57